2. Spatial Data Infrastructure
A  Spatial Data Infrastructure (SDI) refers to the collection of technologies and policies to make geospatial data accessible across institutions and countries.
An SDI aims to coordinate the collection of various geospatial data, and to foster their integrated use at different spatial levels: local, regional or global.
It is essential to realise that implementing an SDIs is not just a matter of technological requirements. The societal dimension is equally important, such as making geospatial data accessible to the general public so that everyone can benefit from it.
Geoportals are a key component of SDIs; they provide a way to find and access geospatial data via the Internet.
2.1. The PDOK Geoportal
In this section, we will explore the Publiek Dienstverlening Op de Kaart (PDOK). These geoportals provide access to geospatial data in the Netherlands. The datasets available through these geoportals can be accessed mostly as OGC-based services (Open Geospatial Consortium) services, but sometimes also as direct data downloads.
The PDOK integrates the metadata from the National Registry (NGR), and several tools and web services that easier to find and use geospatial data from many government agencies in the Netherlands.
For a quick overview on the PDOK geoportal, you may want to watch the PDOK video (audio in Dutch). Activate the subtitles CC. Then, enable auto translation: Settings > Subtitles/CC > Auto-translate > English.
Important
Resources. You will require the latest LTR version of LTR version of QGIS.
This exercise does not require any data files. However, you need a web browser. We recommend Google Chrome because you will need to translate some webpages to English.
- Task 1
Start a web browser and navigate to the PDOK website and explore its contents. Take some time to explore the website’s interface.
- Task 2
In the PDOK home page, click on Bekijk alle dataset or See all datasets. See Fig. 2.5 This will take you to a webpage where you can search the NGR metadata repository.
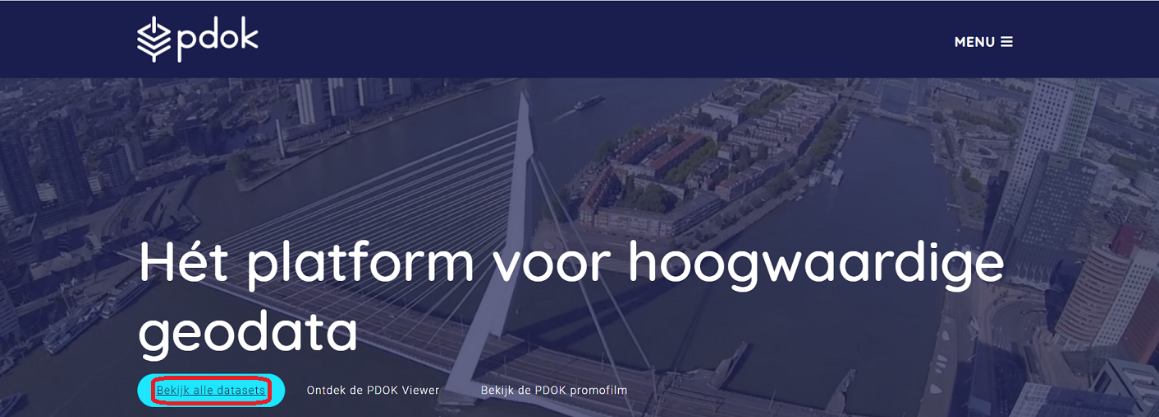
Fig. 2.5 The PDOK home-page
- Task 3
Suppose we need data about the railroad network in the Netherlands. Then, we can use the search bar to find all available datasets.
Note
Reflection. Any good search starts with the right choice of keywords. For this task, it is very relevant to know that, the railroad datasets are part of the Dutch national transport database, called “Nationaal Wegenbestand”; abbreviated as ‘nwb’. The Dutch word for railroads is ‘spoorwegen’.
Type spoorwegen in the search bar and press Enter.
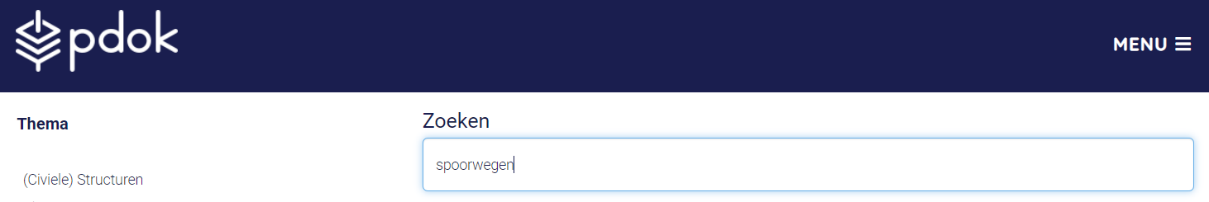
You should see the result of the search below the search bar. Whenever relevant, translate the pages to English. In Chrome, look for the translate icon, then translate to English.
- Task 4
Under Spoorwegen. Click on Details bekijken or View details, to see detailed information about the dataset. See Fig. 2.6
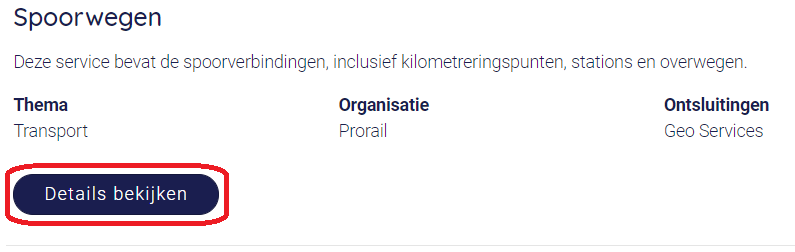
Fig. 2.6 Search result for ‘spoorwegen’
Attention
Question. Why do you think the description of dataset (Omschrijving) is only available in Dutch?
- Task 5
Click on the Geo Services tab. You will see a list of geo-services available for this dataset. Every geo-service mentioned a URL. See Fig. 2.7. This is the most important piece of information you will need. You can use such URL to access the data using several tools: a web browser, a GIS software, or a program that you code yourself.
For example, if you want to see the description of one of the geo-service in the web browser. You can simply copy and paste the URL in a new tab and hit Enter.
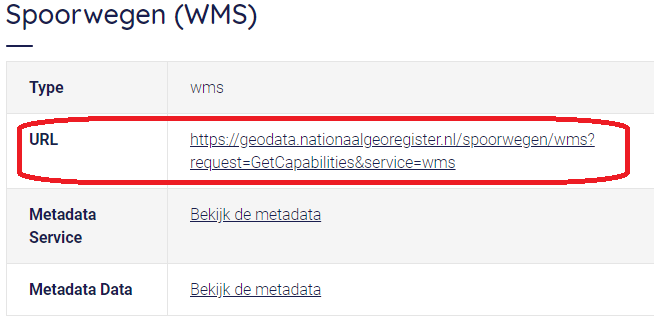
Fig. 2.7 Geo-service of the ‘Spoorwegen’ dataset in the PDOK geoportal
- Task 6
Open a new tab in your web browser, Copy the URL for the Spoorwegen (WMS) service, Paste the URL in the Address bar and hit Enter. A page containing a description of the geo-service will appear. What you see is a description of capabilities of the geo-service in XML (Extensible Markup Language). See Fig. 2.8
Do not worry if you do not understand what you see. The capabilities document is not meant to be read by humans; rather it should be understood by computers across the Internet.
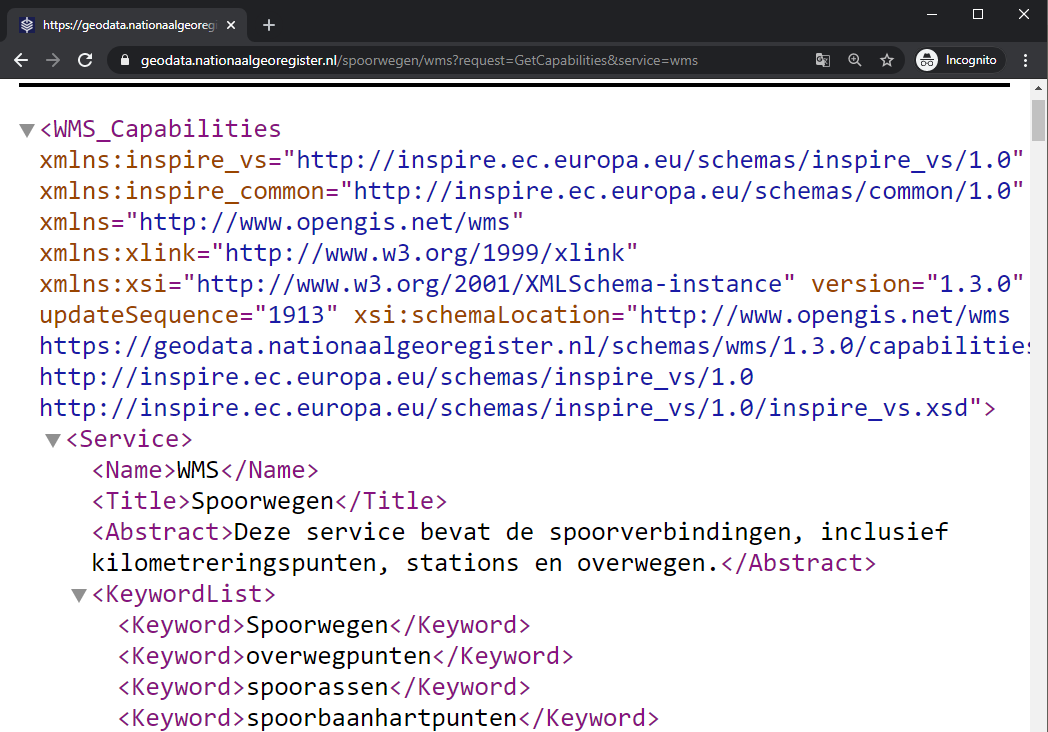
Fig. 2.8 ‘Get-capabilies’ XML document for the ‘Spoorwegen’ dataset
Note
Reflection.
The eXtensible Markup Language (XML) is used to transfer information in the web. Such information is organised using tags. In XML, opening tags are declared using < >, and closing tags using </ >.
Information is enclosed between tags, such as <TagName>info to be transfer</TagName>. For example, if we were to write the name of this course in XML, we would do something like this:
<CourseName>
   Data Integration: Principles, Approaches and User Perspectives
</CourseName>
Attention
Question. Check the information in the get capabilities document for the ‘spoorwegen’ and answer the following questions:
In which CRSs (Coordinate Reference Systems) can this be retrieved?
What is the spatial extend (i.e. Bounding Box) of the data available in EPSG:28992?
How many layers can this service provide? What are the names of such layers?
We visualise the data available in this geo service, by using adding additional parameters to the root URL, such that the web browser requests the data in the proper format.
- Task 7
Paste the following URL (an HTTP request) in the web browser and hit Enter.
1
2
3
4
5
6
7
https://geodata.nationaalgeoregister.nl/spoorwegen/ows?
SERVICE=WMS&&SERVICE=WMS&VERSION=1.3.0&
REQUEST=GetMap&FORMAT=image%2Fpng&TRANSPARENT=false&
LAYERS=spooras&STYLES=spoorwegen%3ASpooras&
CRS=EPSG%3A28992&
WIDTH=1020&HEIGHT=866&
BBOX=113541.12%2C487085.75999999995%2C120395.51999999999%2C492905.27999999997
The web browser should show you the following map:
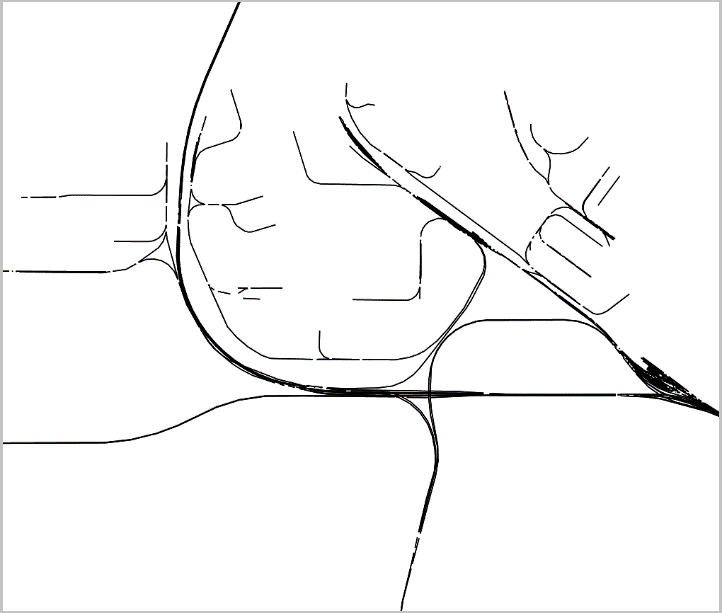
The request above retrieves the railways from an area in The Hague. The
LAYERSparameter defines the name of the data layer that is displayed, here spooras. The extend of the map is controlled by theBBOXparameter, which is declared by defining an extent such as \(min(x), min(y), max(x), max(y)\). For example:BBOX=113541.12%2C487085.75999999995%2C120395.51999999999%2C492905.27999999997The
%2Cin this case means a,.If you change the values of the parameters in the request, you will get a visualisation for a different part of the dataset.
Change the value for the parameter
LAYERS, for another one. Use the get capabilities document to find a valid name and see what happens. You can also try to modify the extent of theBBOX. If you do so, remember to keep the ratio between the coordinates to avoid deforming the image.
- Task 8
Use QGIS to visualise the data provided by this WMS service. To do so, watch the video tutorial on Using WMS Services.
Attention
Question. Go back to the PDOK geoportal and answer the following questions.
What is the purpose of the PDOK facility?
Who are the targeted user groups?
Which organisation is ultimately responsible for the Portal?
What services can PDOK provide for your discipline? Explain.
Section author: André Mano & Manuel Garcia Alvarez